Graph (horizontal bar, line, vertical bar)
The graph widgets are responsible for rendering JPEG graph images.
This widget renders data supplied by the following components:
Note:
- To display the graph widget when the ZIETrans application is accessed through a proxy server, you must configure the ZIETrans application to use the proxy server. For instructions see Configuring ZIETrans applications to use a proxy server.
- This widget may not be suitable for rendering extreme ranges of data.
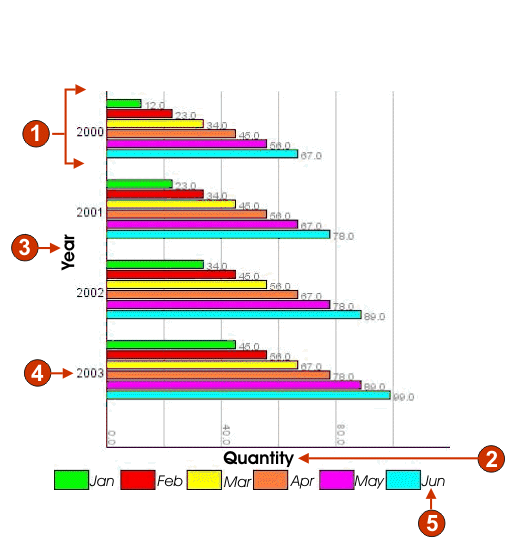
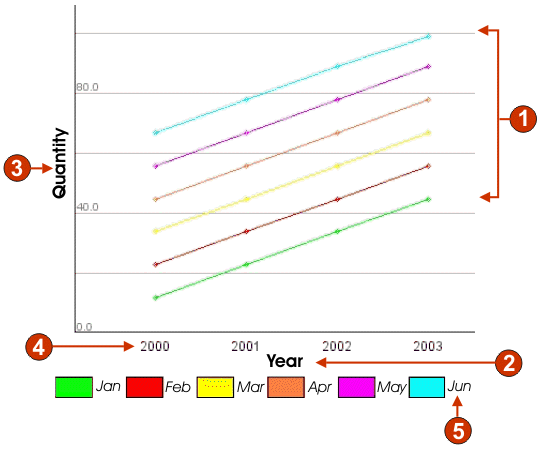
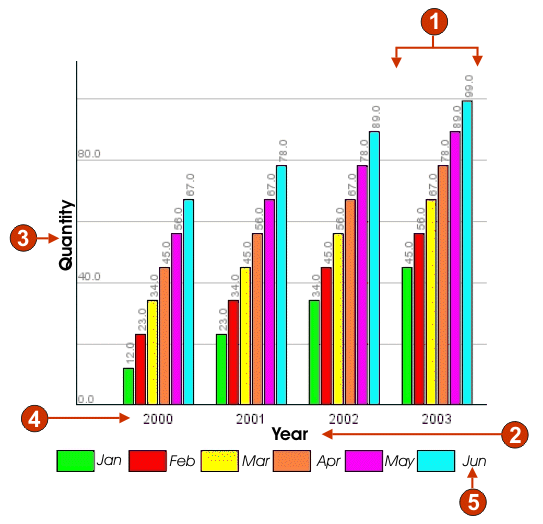
The following examples show how the horizontal bar graph, line
graph, and vertical bar graphs appear on a transformation, using the
data from the Table (visual) component example
as input:
Figure 1. Horizontal bar graph widget example

Figure 2. Line graph widget example

Figure 3. Vertical bar graph widget example

- Data sets (6)
- X-axis title (Year; Quantity on horizontal bar graph)
- Y-axis title (Quantity; Year on horizontal bar graph)
- Data point label (extract)
- Data set label (extract)
The following settings can be configured for this widget:
- Number of data sets
- Specifies the number of data sets to be depicted in the graph. This setting is only displayed in the Insert Host Component wizard.
- Data set source
- Specifies how to obtain values for one or more data sets. Options: Row (each row of the table constitutes one set of data to be graphed) or Column (each column of the table constitutes one set of data to be graphed).
- Width (pixels)
- Width, in pixels, of the graph.
- Height (pixels)
- Height, in pixels, of the graph.
- Background color
- Specifies the color to use as the background of the graph. Click the color selector button to display a color palette.
- Background image
- Enter the name of the image to use for the background of the graph (relative to the Web project's Web Content\Common\Images folder). Click the Browse button to import an image from your system.
- Default Font
- Specify the font, type and font size.
- X-axis title
- Optional. String specifying the X-axis label of the graph.
- Y-axis title
- Optional. String specifying the Y-axis label of the graph.
- Axis color
- Specifies the color to draw the axes of the graph in. Click the color selector button to display a color palette.
- Label color
- Specifies the color to draw the labels of the graph in. Click the color selector button to display a color palette.
- Text antialiasing
- If selected, text antialiasing will be used to smooth the edges of the drawn text.
- Alternate text
- Optional. Specifies the text that appears if the rendered graph image cannot be loaded by the user's client browser.
As with the Number of data sets settings, the following settings
are only displayed in the Insert Host Component
wizard.
- Extract data point labels
- Select this box if you want labels for the graph's data
points to be extracted from a row (or column) of the table.
- Row (or Column)
- Specify the number of the row (or column) from which data point labels should be extracted. The label for this entry field (Row or Column) is dependent upon the value specified for the Data set source setting.
- Extract data set labels (for legend)
- Select this box if you want labels for the graph's data
sets to be extracted from a row (or column) of the table.
- Row (or Column)
- Specify the number of the row (or column) from which data set labels should be extracted. The label for this entry field (Row or Column) is dependent upon the value specified for the Data set source setting.
- Data sets
- Click this button to display the Data Source Settings dialog, which enables you to specify the following additional settings for the data sources:
- Data set 'n', 'row' or 'column'
- The number ('n') of these fields matches the value specified in the Data set source setting. Enter the number of any row or column of data you want to use for the data set. This enables you to reorder or duplicate sets of data in the graph. The last part of the label for this entry field is dependent upon the value specified for the Data set source setting. The entry field label matches the value specified for the Data set source setting.
- color
- There is a color button for each of the Data set 'n', 'row' or 'column' settings. The buttons show the color to use for the data set in the graph. Click the button to display a color palette if you want to change the data set color.
- legend label
- Supply the label to use for the legend. Only enabled if Extract data set labels (for legend) is not selected.